2. Run the mass-balance calibration
Sometimes you will need to do the mass-balance calibration yourself. For example if you use alternate climate data, or change the parameters of the model. Here we show how to run the calibration for all available reference glaciers, but you can also doit for any regional subset of course.
The output of this script are the ref_tstars.csv and
crossval_tstars.csv files, both found in the working directory. The
ref_tstars.csv file can then be used for further runs, simply by
copying it in the corresponding working directory.
Script
# Python imports
from os import path
from glob import glob

# Libs
import numpy as np
import pandas as pd
import geopandas as gpd

# Locals
import oggm
from oggm import cfg, utils, tasks, workflow
from oggm.workflow import execute_entity_task

# Module logger
import logging
log = logging.getLogger(__name__)

# RGI Version
rgi_version = '6'

# Initialize OGGM and set up the run parameters
cfg.initialize()

# Local paths (where to write the OGGM run output)
WORKING_DIR = path.join(path.expanduser('~'), 'tmp',
                        'OGGM_ref_mb_RGIV{}'.format(rgi_version))
utils.mkdir(WORKING_DIR, reset=True)
cfg.PATHS['working_dir'] = WORKING_DIR

# We are running the calibration ourselves
cfg.PARAMS['run_mb_calibration'] = True

# No need for intersects since this has an effect on the inversion only
cfg.PARAMS['use_intersects'] = False

# Use multiprocessing?
cfg.PARAMS['use_multiprocessing'] = True

# Set to True for operational runs
cfg.PARAMS['continue_on_error'] = False

# Pre-download other files which will be needed later
_ = utils.get_cru_file(var='tmp')
_ = utils.get_cru_file(var='pre')
rgi_dir = utils.get_rgi_dir(version=rgi_version)

# Get the reference glacier ids (they are different for each RGI version)
df, _ = utils.get_wgms_files(version=rgi_version)
rids = df['RGI{}0_ID'.format(rgi_version)]

# Make a new dataframe with those (this takes a while)
log.info('Reading the RGI shapefiles...')
rgidf = []
for reg in df['RGI_REG'].unique():
    if reg == '19':
        continue  # we have no climate data in Antarctica
    fn = '*' + reg + '_rgi{}0_*.shp'.format(rgi_version)
    fs = list(sorted(glob(path.join(rgi_dir, '*', fn))))[0]
    sh = gpd.read_file(fs)
    rgidf.append(sh.loc[sh.RGIId.isin(rids)])
rgidf = pd.concat(rgidf)
rgidf.crs = sh.crs  # for geolocalisation

# We have to check which of them actually have enough mb data.
# Let OGGM do it:
gdirs = workflow.init_glacier_regions(rgidf)
# We need to know which period we have data for
log.info('Process the climate data...')
execute_entity_task(tasks.process_cru_data, gdirs, print_log=False)
gdirs = utils.get_ref_mb_glaciers(gdirs)
# Keep only these
rgidf = rgidf.loc[rgidf.RGIId.isin([g.rgi_id for g in gdirs])]

# Save
log.info('For RGIV{} we have {} reference glaciers.'.format(rgi_version,
                                                            len(rgidf)))
rgidf.to_file(path.join(WORKING_DIR, 'mb_ref_glaciers.shp'))

# Sort for more efficient parallel computing
rgidf = rgidf.sort_values('Area', ascending=False)

# Go - initialize working directories
gdirs = workflow.init_glacier_regions(rgidf)

# Prepro tasks
task_list = [
    tasks.glacier_masks,
    tasks.compute_centerlines,
    tasks.initialize_flowlines,
    tasks.catchment_area,
    tasks.catchment_intersections,
    tasks.catchment_width_geom,
    tasks.catchment_width_correction,
]
for task in task_list:
    execute_entity_task(task, gdirs)

# Climate tasks
execute_entity_task(tasks.process_cru_data, gdirs)
tasks.compute_ref_t_stars(gdirs)
tasks.distribute_t_stars(gdirs)
execute_entity_task(tasks.apparent_mb, gdirs)
# Recompute after the first round - this is being picky but this is
# Because geometries may change after apparent_mb's filtering
tasks.compute_ref_t_stars(gdirs)
tasks.distribute_t_stars(gdirs)
execute_entity_task(tasks.apparent_mb, gdirs)

# Model validation
tasks.quick_crossval_t_stars(gdirs)  # for later
tasks.distribute_t_stars(gdirs)  # To restore after cross-val

# Tests: for all glaciers, the mass-balance around tstar and the
# bias with observation should be approx 0
from oggm.core.massbalance import (ConstantMassBalance, PastMassBalance)
for gd in gdirs:
    heights, widths = gd.get_inversion_flowline_hw()

    mb_mod = ConstantMassBalance(gd, bias=0)  # bias=0 because of calib!
    mb = mb_mod.get_specific_mb(heights, widths)
    np.testing.assert_allclose(mb, 0, atol=10)  # numerical errors

    mb_mod = PastMassBalance(gd)  # Here we need the computed bias
    refmb = gd.get_ref_mb_data().copy()
    refmb['OGGM'] = mb_mod.get_specific_mb(heights, widths, year=refmb.index)
    np.testing.assert_allclose(refmb.OGGM.mean(), refmb.ANNUAL_BALANCE.mean(),
                               atol=10)

# Log
log.info('Calibration is done!')
Cross-validation
The results of the cross-validation are found in the crossval_tstars.csv
file. Let’s replicate Figure 3 in Marzeion et al., (2012) :
# Python imports
from os import path

# Libs
import numpy as np
import pandas as pd
import geopandas as gpd

# Locals
import oggm
from oggm import cfg, workflow
from oggm.core.massbalance import PastMassBalance
import matplotlib.pyplot as plt

# RGI Version
rgi_version = '6'

# Initialize OGGM and set up the run parameters
cfg.initialize()

# Local paths (where to find the OGGM run output)
WORKING_DIR = path.join(path.expanduser('~'), 'tmp',
                        'OGGM_ref_mb_RGIV{}'.format(rgi_version))
cfg.PATHS['working_dir'] = WORKING_DIR

# Read the rgi file
rgidf = gpd.read_file(path.join(WORKING_DIR, 'mb_ref_glaciers.shp'))

# Go - initialize working directories
gdirs = workflow.init_glacier_regions(rgidf)

# Cross-validation
file = path.join(cfg.PATHS['working_dir'], 'crossval_tstars.csv')
cvdf = pd.read_csv(file, index_col=0)
for gd in gdirs:
    t_cvdf = cvdf.loc[gd.rgi_id]
    heights, widths = gd.get_inversion_flowline_hw()
    # Mass-balance model with cross-validated parameters instead
    mb_mod = PastMassBalance(gd, mu_star=t_cvdf.cv_mustar,
                             bias=t_cvdf.cv_bias,
                             prcp_fac=t_cvdf.cv_prcp_fac)
    # Mass-blaance timeseries, observed and simulated
    refmb = gd.get_ref_mb_data().copy()
    refmb['OGGM'] = mb_mod.get_specific_mb(heights, widths,
                                           year=refmb.index)
    # Compare their standard deviation
    std_ref = refmb.ANNUAL_BALANCE.std()
    rcor = np.corrcoef(refmb.OGGM, refmb.ANNUAL_BALANCE)[0, 1]
    if std_ref == 0:
        # I think that such a thing happens with some geodetic values
        std_ref = refmb.OGGM.std()
        rcor = 1
    # Store the scores
    cvdf.loc[gd.rgi_id, 'CV_MB_BIAS'] = (refmb.OGGM.mean() -
                                         refmb.ANNUAL_BALANCE.mean())
    cvdf.loc[gd.rgi_id, 'CV_MB_SIGMA_BIAS'] = (refmb.OGGM.std() /
                                               std_ref)
    cvdf.loc[gd.rgi_id, 'CV_MB_COR'] = rcor
    mb_mod = PastMassBalance(gd, mu_star=t_cvdf.interp_mustar,
                             bias=t_cvdf.cv_bias,
                             prcp_fac=t_cvdf.cv_prcp_fac)
    refmb['OGGM'] = mb_mod.get_specific_mb(heights, widths, year=refmb.index)
    cvdf.loc[gd.rgi_id, 'INTERP_MB_BIAS'] = (refmb.OGGM.mean() -
                                             refmb.ANNUAL_BALANCE.mean())

# Marzeion et al Figure 3
f, (ax1, ax2) = plt.subplots(1, 2, figsize=(12, 6), sharey=True)
bins = np.arange(20) * 400 - 3800
cvdf['CV_MB_BIAS'].plot(ax=ax1, kind='hist', bins=bins, color='C3', label='')
ax1.vlines(cvdf['CV_MB_BIAS'].mean(), 0, 120, linestyles='--', label='Mean')
ax1.vlines(cvdf['CV_MB_BIAS'].quantile(), 0, 120, label='Median')
ax1.vlines(cvdf['CV_MB_BIAS'].quantile([0.05, 0.95]), 0, 120, color='grey',
                                       label='5% and 95%\npercentiles')
ax1.text(0.01, 0.99, 'N = {}'.format(len(gdirs)),
         horizontalalignment='left',
         verticalalignment='top',
         transform=ax1.transAxes)

ax1.set_ylim(0, 120)
ax1.set_ylabel('N Glaciers')
ax1.set_xlabel('Mass-balance error (mm w.e. yr$^{-1}$)')
ax1.legend(loc='best')
cvdf['INTERP_MB_BIAS'].plot(ax=ax2, kind='hist', bins=bins, color='C0')
ax2.vlines(cvdf['INTERP_MB_BIAS'].mean(), 0, 120, linestyles='--')
ax2.vlines(cvdf['INTERP_MB_BIAS'].quantile(), 0, 120)
ax2.vlines(cvdf['INTERP_MB_BIAS'].quantile([0.05, 0.95]), 0, 120, color='grey')
ax2.set_xlabel('Mass-balance error (mm w.e. yr$^{-1}$)')
plt.tight_layout()
fn = path.join(WORKING_DIR, 'mb_crossval_rgi{}.pdf'.format(rgi_version))
plt.savefig(fn)

print('Median bias: {:.2f}'.format(cvdf['CV_MB_BIAS'].median()))
print('Mean bias: {:.2f}'.format(cvdf['CV_MB_BIAS'].mean()))
print('RMS: {:.2f}'.format(np.sqrt(np.mean(cvdf['CV_MB_BIAS']**2))))
print('Sigma bias: {:.2f}'.format(np.mean(cvdf['CV_MB_SIGMA_BIAS'])))
This should generate a figure similar to:
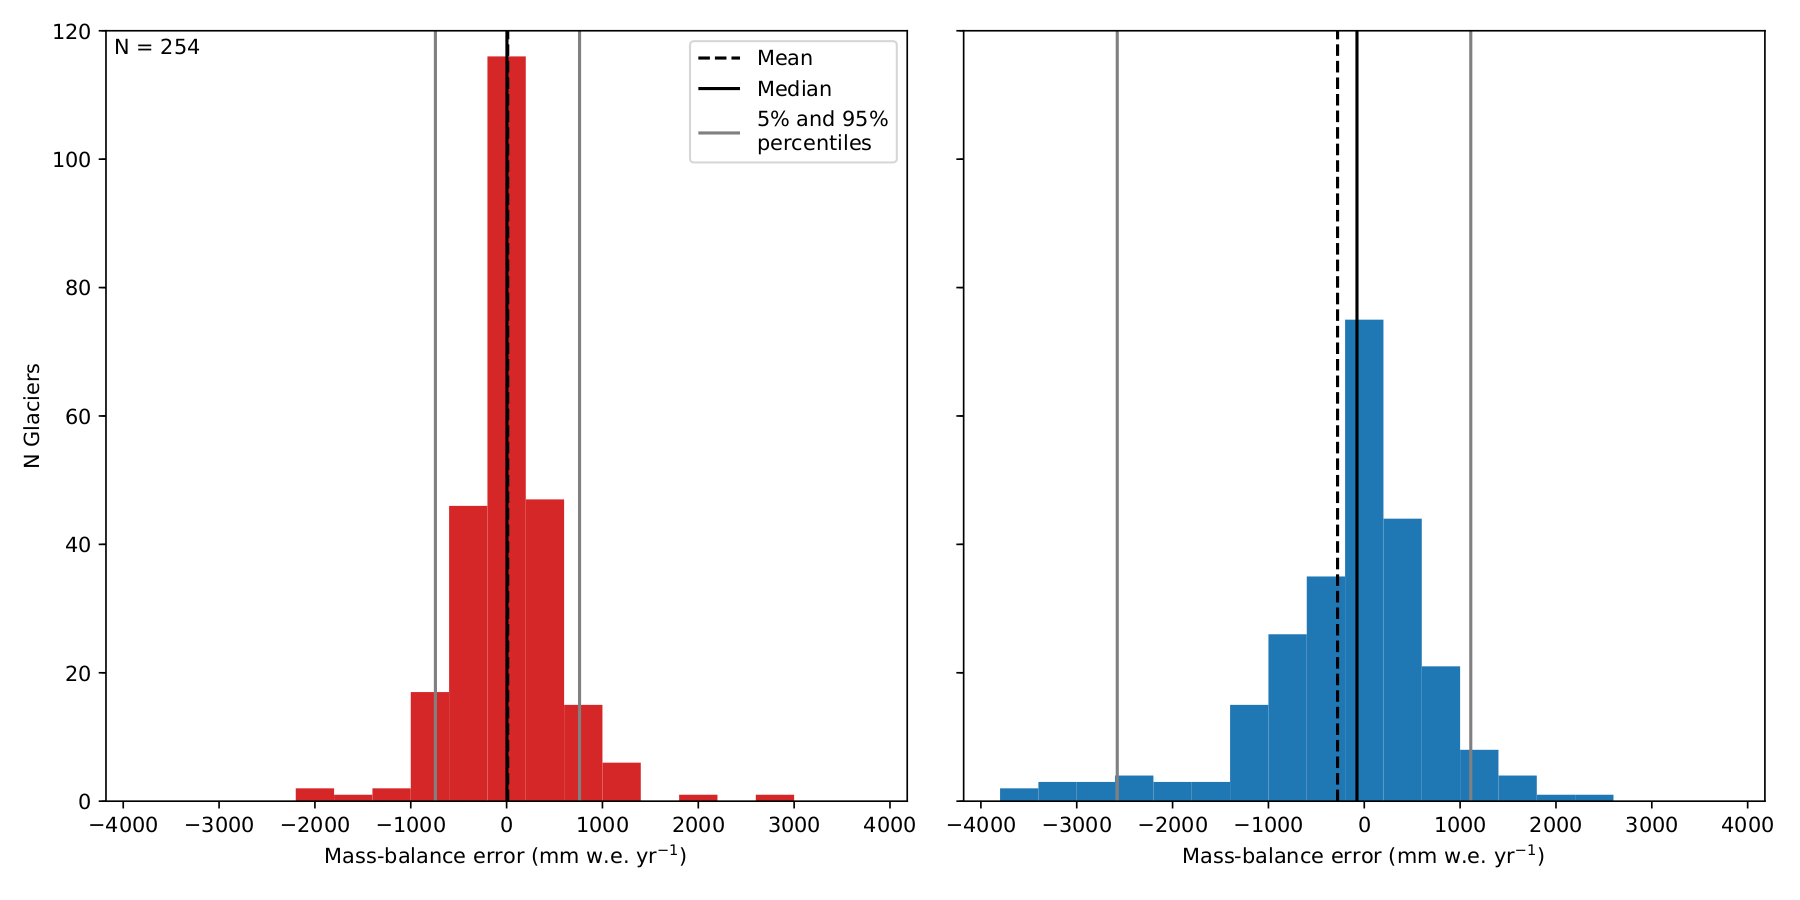
Benefit of spatially interpolating \(t^{*}\) instead of \(\mu ^{*}\) as shown by leave-one-glacier-out cross-validation (N = 255). Left: error distribution of the computed mass-balance if determined by the interpolated \(t^{*}\). Right: error distribution of the mass-balance if determined by interpolation of \(\mu ^{*}\).