Climate data#
Here are the various climate datasets that OGGM can handle automatically, using the for instance one of the following functions to pre-process the climate data:
from oggm.tasks import process_w5e5_data
from oggm.tasks import import process_cru_data
from oggm.tasks import import process_histalp_data
from oggm.tasks import import process_ecmwf_data
W5E5#
GSWP3-W5E5#
As of v1.6, GSWP3-W5E5 [Lange_et_al_2021] is the standard baseline climate dataset used by OGGM for all preprocessed directories. GSWP3-W5E5 is a combination of W5E5 v2.0 [Lange_et_al_2021] for 1979-2019 with GSWP3 v1.09 [Kim_2017] homogenized to W5E5 for 1901-1978. Note that the baseline url file paths are only named W5E5 to make it shorter, however they include both, GSWP3 and W5E5 data.
GSWP3-W5E5 has a spatial resolution of 0.5° over the entire globe and is also the observational climate input data for the impact assessments in phase 3a of the Inter-Sectoral Impact Model Intercomparison Project ` ISIMIP3a <https://www.isimip.org/protocol/3>`_. Over land, W5E5 uses the WATCH Forcing Data methodology version 2 which they applied on ERA5 data (WFDE5; Weedon et al., 2014, [Cuchi_2020]). W5E5 precipitation is based on WFDE5 rainfall and snowfall bias-adjusted using version 2.3 of the Global Precipitation Climatology Project (GPCP; Adler et al., 2003) monthly precipitation.
One of the reasons, why we chose W5E5 for all preprocessed directories is that the climate input data for the ISIMIP3b CMIP6 GCMs have been bias-corrected using this dataset. Usually, we need to bias-correct the GCMs ourselves to approximately coincide with the applied climate dataset used for model calibration. If we use W5E5 for the calibration of the mass-balance model and the ISIMIP3b GCMs for projections, no additional bias-correction from OGGM is needed, as the statistically downscaled GCMs from ISIMIP3b (0.5° resolution) are already internally bias-adjusted to W5E5 over the period 1979–2014 [Lange_2019]. This is a big advantage, as their quantile-mapping bias correction approach is more robust for extreme values than the “delta-methof” commonly applied in OGGM.
When using this data, please refer to the original providers:
if you only use W5E5 data (1979-2019):
- Lange_et_al_2021(1,2)
Lange, S., Menz, C., Gleixner, S., Cucchi, M., Weedon, G. P., Amici, A., Bellouin, N., Müller Schmied, H., Hersbach, H., Buontempo, C. & Cagnazzo, C. (2021). WFDE5 over land merged with ERA5 over the ocean (W5E5 v2.0). ISIMIP Repository. https://doi.org/10.48364/ISIMIP.342217
- Cuchi_2020
Cucchi, M., Weedon, G. P., Amici, A., Bellouin, N., Lange, S., Müller Schmied, H., Hersbach, H. and Buontempo, C. (2020). WFDE5: bias-adjusted ERA5 reanalysis data for impact studies. Earth System Science Data, 12, 2097–2120
if you also use the GSWP3 part of the GSWP3-W5E5 data (1901-1978):
Dirmeyer, P. A., Gao, X., Zhao, M., Guo, Z., Oki, T. and Hanasaki, N. (2006). GSWP-2: Multimodel Analysis and Implications for Our Perception of the Land Surface. Bulletin of the American Meteorological Society, 87(10), 1381–98.
- Kim_2017
Kim, H. (2017). Global Soil Wetness Project Phase 3 Atmospheric Boundary Conditions (Experiment 1) [Data set]. Data Integration and Analysis System (DIAS). https://doi.org/10.20783/DIAS.501
for more info:
- Lange_2019
Trend-preserving bias adjustment and statistical downscaling with ISIMIP3BASD (v1.0). Geoscientific Model Development 12(7), 3055–3070. https://doi:10.5194/gmd-12-3055-2019
CRU#
CRU TS data provided by the Climatic Research Unit of the University of East Anglia. If asked to do so, OGGM will automatically download and unpack the latest dataset from the CRU servers.
To download CRU data you can use the following convenience functions:
from oggm.shop import cru
cru.get_cl_file()
cru.get_cru_file(var='tmp')
cru.get_cru_file(var='pre')
Warning
While the downloaded zip files are ~370mb in size, they are ~5.6Gb large after decompression!
The raw, coarse (0.5°) dataset is then downscaled to a higher resolution grid (CRU CL v2.0 at 10’ resolution [New_et_al_2002]) following the anomaly mapping approach described by Tim Mitchell in his CRU faq (Q25). Note that we don’t expect this downscaling to add any new information than already available at the original resolution, but this allows us to have an elevation-dependent dataset based on a presumably better climatology. The monthly anomalies are computed following [Harris_et_al_2010] : we use standard anomalies for temperature and scaled (fractional) anomalies for precipitation.
When using these data, please refer to the original providers:
- Harris_et_al_2010
Harris, I., Jones, P. D., Osborn, T. J., & Lister, D. H. (2014). Updated high-resolution grids of monthly climatic observations - the CRU TS3.10 Dataset. International Journal of Climatology, 34(3), 623–642. https://doi.org/10.1002/joc.3711
- New_et_al_2002
New, M., Lister, D., Hulme, M., & Makin, I (2002). A high-resolution data set of surface climate over global land areas. Climate Research, 21(715), 1–25. https://doi.org/10.3354/cr021001
ERA5 and CERA-20C#
Since OGGM v1.4, users can also use reanalysis data from the ECMWF, the European Centre for Medium-Range Weather Forecasts based in Reading, UK. OGGM can use the ERA5 (1979-2019, 0.25° resolution) and CERA-20C (1900-2010, 1.25° resolution) datasets as baseline. One can also apply a combination of both, for example by applying the CERA-20C anomalies to the reference ERA5 for example (useful only in some circumstances).
When using these data, please refer to the original provider:
For example for ERA5:
Hersbach, H., Bell, B., Berrisford, P., Biavati, G., Horányi, A., Muñoz Sabater, J., Nicolas, J., Peubey, C., Radu, R., Rozum, I., Schepers, D., Simmons, A., Soci, C., Dee, D., Thépaut, J-N. (2019): ERA5 monthly averaged data on single levels from 1979 to present. Copernicus Climate Change Service (C3S) Climate Data Store (CDS). (Accessed on < 01-12-2020 >), 10.24381/cds.f17050d7
HISTALP#
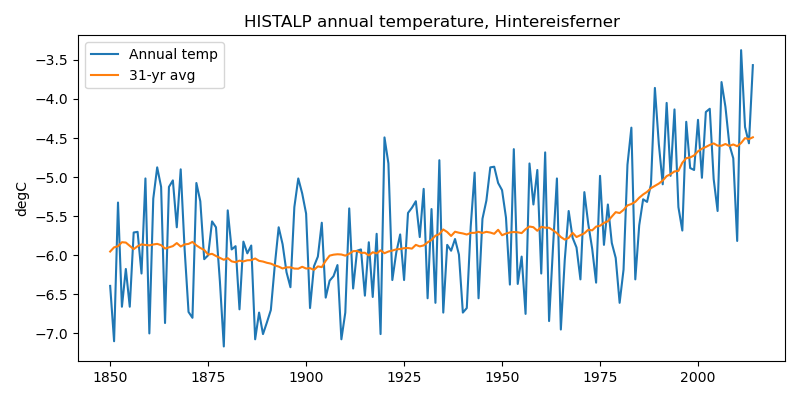
OGGM can also automatically download and use the data from the HISTALP dataset (available only for the European Alps region, more details in [Chimani_et_al_2012]. The data is available at 5’ resolution (about 0.0833°) from 1801 to 2014. However, the data is considered spurious before 1850. Therefore, we recommend to use data from 1850 onwards.
- Chimani_et_al_2012
Chimani, B., Matulla, C., Böhm, R., Hofstätter, M.: A new high resolution absolute Temperature Grid for the Greater Alpine Region back to 1780, Int. J. Climatol., 33(9), 2129–2141, DOI 10.1002/joc.3574, 2012.
In [1]: example_plot_temp_ts()
Any other climate dataset#
It is fairly easy to force OGGM with other datasets too. Recent publications have used plenty of options, from ERA5-Land to regional reanalyses or more.
GCM data#
OGGM can also use climate model output to drive the mass balance model. In this case we still rely on gridded observations (e.g. W5E5) for the reference climatology and apply the GCM anomalies computed from a preselected reference period. This method is often called the delta method.
Visit our online tutorials to see how this can be done (OGGM run with GCM tutorial).